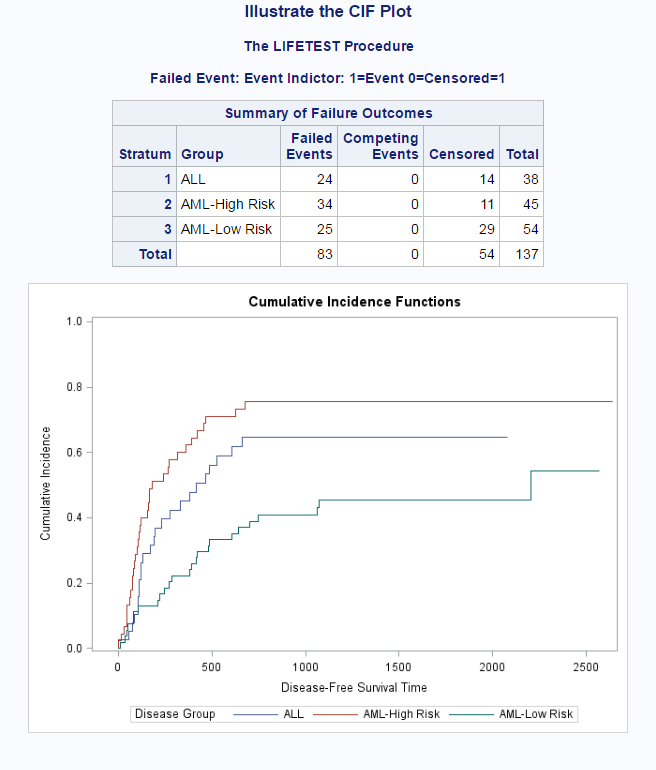
In my previous post, I showed you how to change the titles in graphs produced by analytical procedures; today I will show you how to remove subtitles that procedures display on some output pages. The following step creates output that contains a SAS title ('Illustrate the CIF Plot'), a PROCTITLE ('The LIFETEST Procedure'), and a subtitle ('Failed Event: Event Indictor: 1=Event 0=Censored=1') that is set by the LIFETEST procedure.
title 'Illustrate the CIF Plot'; ods graphics on; proc lifetest data=sashelp.Bmt plots=all; strata group; ods select FailureSummary cifPlot; time T*Status(0) / eventcode=1; run; |
Click on images to enlarge.
You can remove the first and all subsequent titles that are set by TITLEn statements by specifying:
title; |
You can remove the PROCTITLE by specifying:
ods noproctitle; |
There is not a one-line specification that will remove subtitles, but you can use the ODS Document and PROC DOCUMENT. The following step captures the procedure output into an ODS Document named MYDOC:
title; ods noproctitle; ods document name=mydoc (write); proc lifetest data=sashelp.Bmt plots=all; strata group; ods select FailureSummary cifPlot; time T*Status(0) / eventcode=1; run; ods document close; |
The WRITE option creates a new document rather than appending to an old document. The following step lists the contents of the document:
proc document name=mydoc; list / levels=all; run; |
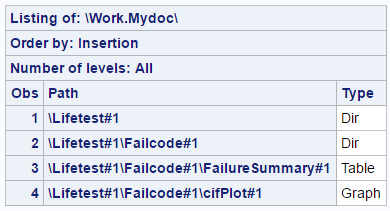
This document contains a table and a graph. The listing provides you with the paths that you need to copy and paste to write the next step, which replays the table and graph while suppressing all subtitles:
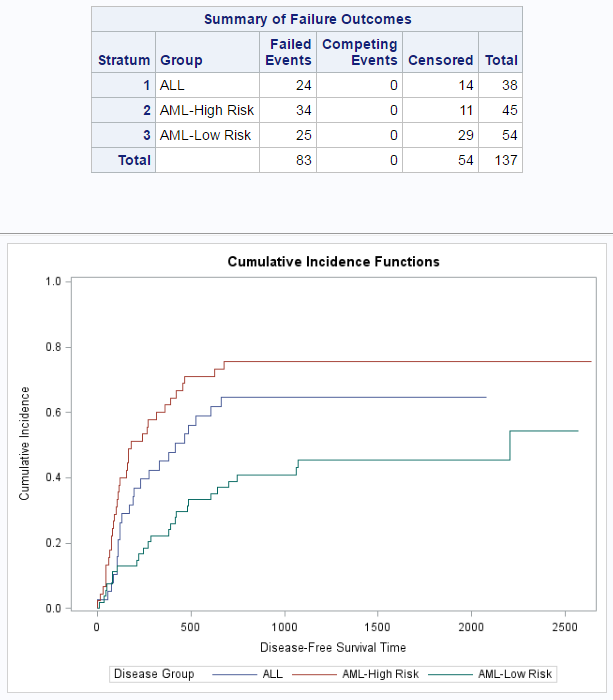
proc document name=mydoc; obstitle \Lifetest#1\Failcode#1\FailureSummary#1; replay \Lifetest#1\Failcode#1\FailureSummary#1; obstitle \Lifetest#1\Failcode#1\cifPlot#1; replay \Lifetest#1\Failcode#1\cifPlot#1; run; |
The OBSTITLE (subtitle object) statements, when specified with only an object path, suppress all subtitles. The REPLAY statements display the table and the graph.
Since the code depends a previous step, and the results from that step (the contents of the ODS Document) can be stored in a SAS data set, you can easily use a macro to avoid copying and pasting paths to the PROC DOCUMENT step:
ods document name=mydoc (write);
proc lifetest data=sashelp.Bmt plots=all;
   strata group;
   ods select FailureSummary cifPlot;
   time T*Status(0) / eventcode=1;
run;
ods document close;

%macro nosubs;
proc document name=mydoc;
   ods exclude properties;
   ods output properties=p;
   list / levels=all;
run;

data _null_;
   set p end=eof;
   if _n_ = 1 then call execute('proc document name=mydoc;');
   if type = 'Table' or type = 'Graph' then do;
      call execute(catx(' ', 'obstitle', path, ';'));
      call execute(catx(' ', 'replay'  , path, ';'));
   end;
   if eof then call execute('quit;');
run;
%mend;

%nosubs |
CALL EXECUTE writes SAS code to a buffer, and that code is run after the DATA step terminates. The macro creates the same PROC DOCUMENT step and results as the first PROC DOCUMENT step--a table and a graph with no titles or subtitles. See the documentation for PROC DOCUMENT for more information about rearranging, subsetting, and generally controlling SAS output.
Members of the Advanced Analytics division at SAS (who create products including SAS/STAT, SAS/QC, SAS/ETS, SAS/IML, SAS/OR, and many others) create documentation that contains text interleaved with output. They use macros that run PROC DOCUMENT to display subsets of procedure ouput. You can use a very similar system called StatRep to create documents that contain SAS code and reproducible results.
Update (November 28, 2016).
You can use the following step to replay the table and the graph with no page break in between.
proc document name=mydoc;
   obstitle \Lifetest#1\Failcode#1\FailureSummary#1;
   obpage   \Lifetest#1\Failcode#1\cifPlot#1 / delete;
   obstitle \Lifetest#1\Failcode#1\cifPlot#1;
   replay   \Lifetest#1\Failcode#1\FailureSummary#1,
            \Lifetest#1\Failcode#1\cifPlot#1;
quit; |
Update (January 27, 2017).
The following steps replay all tables and graphs without any titles or subtitles for any ODS document:
proc document name=mydoc;
   ods output properties=p;
   list / levels=all;
run;

options source;
data _null_;
   call execute('proc document name=mydoc;');
   do i = 1 to nobs;
      set p point=i nobs=nobs;
      if type ne 'Dir' then do;
         call execute(catx(' ', 'obstitle', path, ';'));
         call execute(catx(' ', 'obpage  ', path, '/ delete;'));
      end;
   end;
   call execute('replay');
   do i = 1 to nobs;
      set p point=i;
      if type ne 'Dir' then
         call execute(catt(path, ifc(i eq nobs, '; quit;', ',')));
   end;
   stop;
run; |